Plot shape estimator
How many shapes does the plot have? 🏷️
The shapes of plots in Seoul are highly diverse. They include
flags, squares, long-squares, trapezoids, triangles and other forms that are difficult to define, and a building exists within each plot.
Since architects design within a given plot, the direction of the design may change depending on the shape of the site.
An architect empirically judges the shape of a plot and develops the design accordingly. For an excessively long-square shape, the architect scales the building down along the long-side axis.
For a triangular plot, the architect designs the building to eliminate acute angles. In this way, a person can subjectively
judge the type and
define the shape.
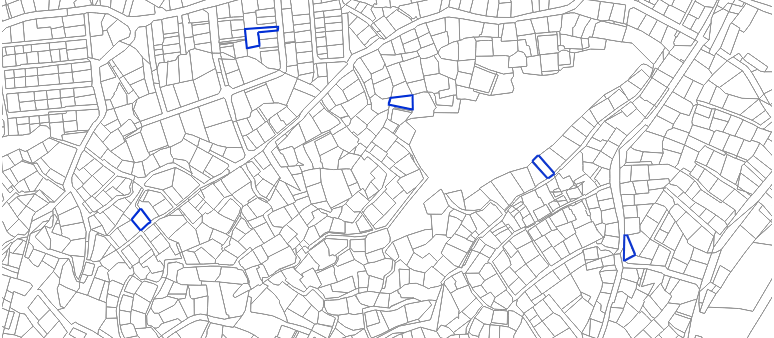 Somewhere in Seoul
The question, then, is how a computer can determine and define the shape of a plot. This article examines how computers can determine the shape of a plot and support the development of designs.
Properties of the plot
A plot is an individual 2D geometry, and expressions such as long, short, round, and pointed are related to the properties of that geometry.
The question is how a computer can be made to understand such properties. The first step is to
define the properties of the plot.
The most common plot shapes are considered here, and they are shown below.
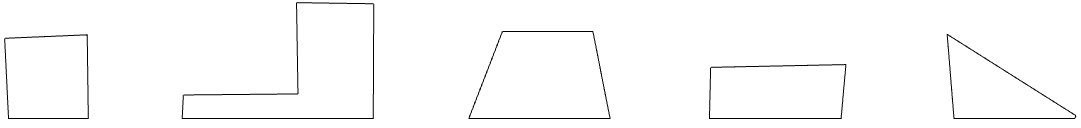 Most common shapes of plots
From the left, square · flag · trapezoid · long-square · triangle
The square and long-square shapes can be defined based on the aspect ratio, the sum of the interior angles(360'), the bounding box ratio, and similar measures. Similarly, the triangle shape can be defined by the sum of its interior angles(180').
In general, the defining feature of a flag shape is that the shape obtained by subtracting the flag shape itself from its convex hull is a triangle.
Finally, the trapezoid shape can be defined by the number of triangles obtained by subtracting the trapezoid shape from its bounding box. These properties are visualized as follows.
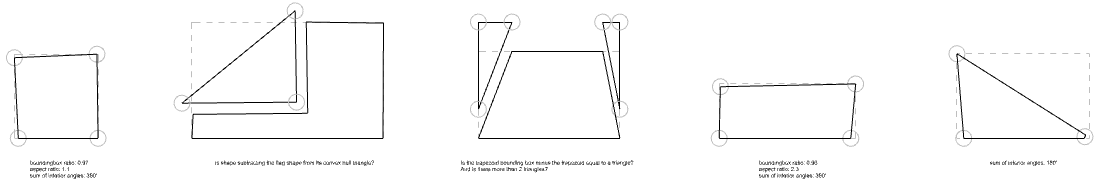 Properties of each plot
Generate training data
To teach the computer the properties of each plot,
data must be generated. A person understands information visually, whereas
computers only understand numeric values.
Therefore, all properties must be converted into numeric form. For this purpose, a
PlotData object is defined.
PlotData has properties defined above.
However, these properties alone do not fully categorize the shape of the plot. This can be regarded as a primary classification task for training the computer.
As noted above, examining the
preprocessed data reveals plots that are
classified differently from the defined properties.
After the misclassified data is filtered out once more and the
end data is generated, the computer is ready to be trained.
The structure of the end data is as follows.
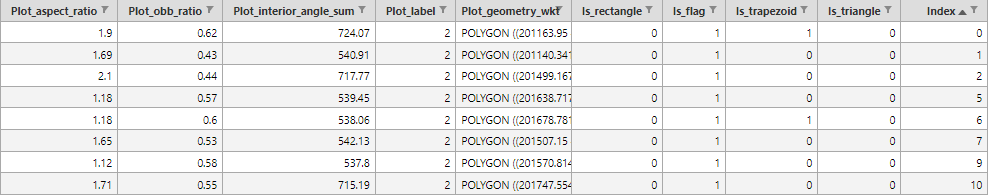 End data of the flag plot (defined ShapeLabel)
Plot shape estimator
As the detailed background in machine learning is beyond the scope of this work, the detailed training procedure is omitted here.
All of scikit-learn's classification models were tested, but their performance was lower than expected, so a TensorFlow sequential
model was used instead.
From
testing a few cases, a usable model appears to have been created as a prototype, although the result is not yet fully satisfactory.
With this model, the computer can be directed to decide the direction in which to cut the mass.
 Getting mass